After connecting a Data Store in the Netskope One DSPM user interface, Netskope One DSPM will check to see if it has sufficient permissions to scan the Data Store.
If it doesn't, one or more error messages will be displayed.
If the permission check is successful, Netskope One DSPM will connect to your Data Store, import query logs, sample fields in your Data Store to determine if they contain sensitive data (if configured to do so), import query logs and risk assess all queries (if configured to do so), and generate the Netskope One DSPM dashboard.
Please note that the first time Netskope One DSPM connects to any Data Store may take several hours, depending on (1) the number of fields in your Data Store and (2) the number of queries in your Data Store.
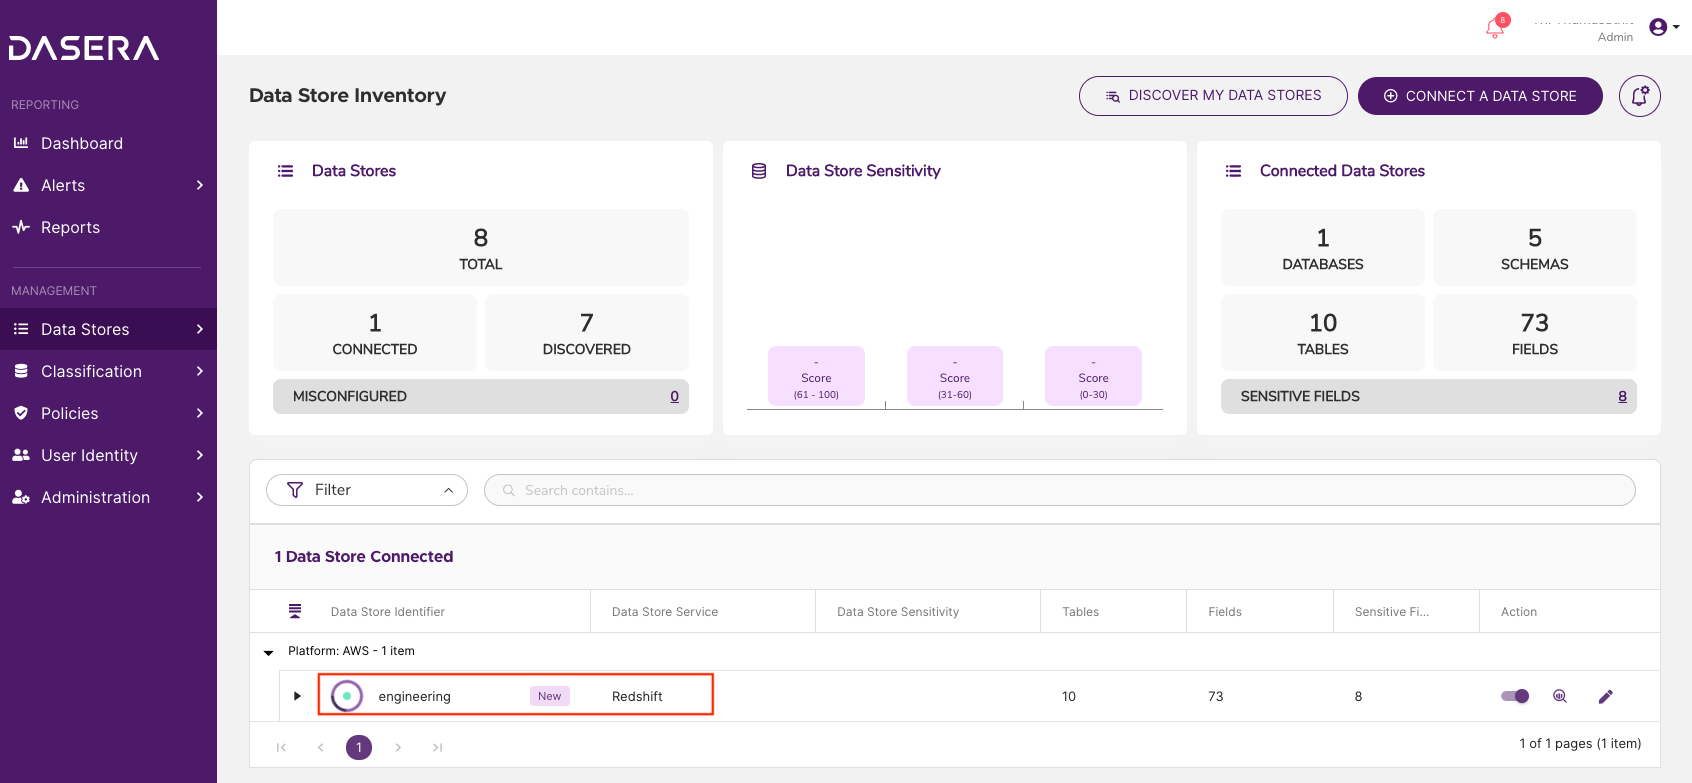
After logs are copied from your Data Store to Netskope One DSPM, the dashboard can be reloaded to show incremental progress during the analysis of queries. For the initial scan, we recommend keeping the Netskope One DSPM home page/dashboard open to see if the number of alerts is growing. Once you’ve confirmed that Netskope One DSPM is operating properly, you can leave Netskope One DSPM alone -- if you have set up Notifications, it will send a notification once the full initial scan is complete. On the Data Stores page, you will see a spinner next to the Data Store that is still in the process of connecting.
 By default, Redshift keeps 2-5 days of data in its query log tables. Netskope One DSPM will only be able to assess queries contained in the Redshift logs. In Snowflake and Google Big Query, Netskope One DSPM will be able to scan the last 14 days of queries.